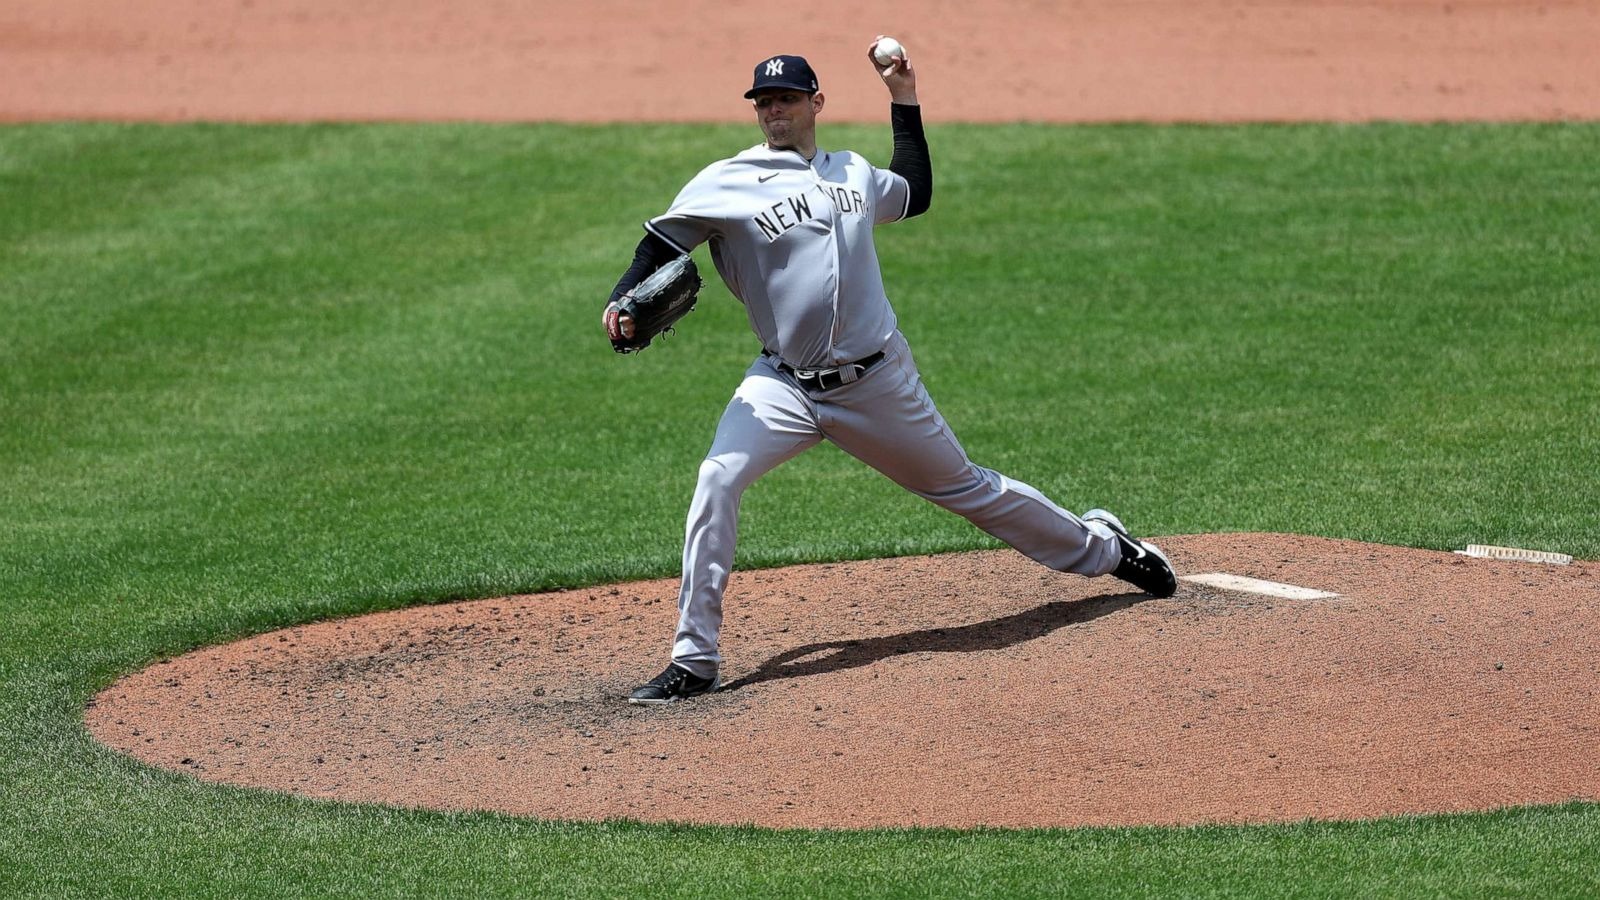
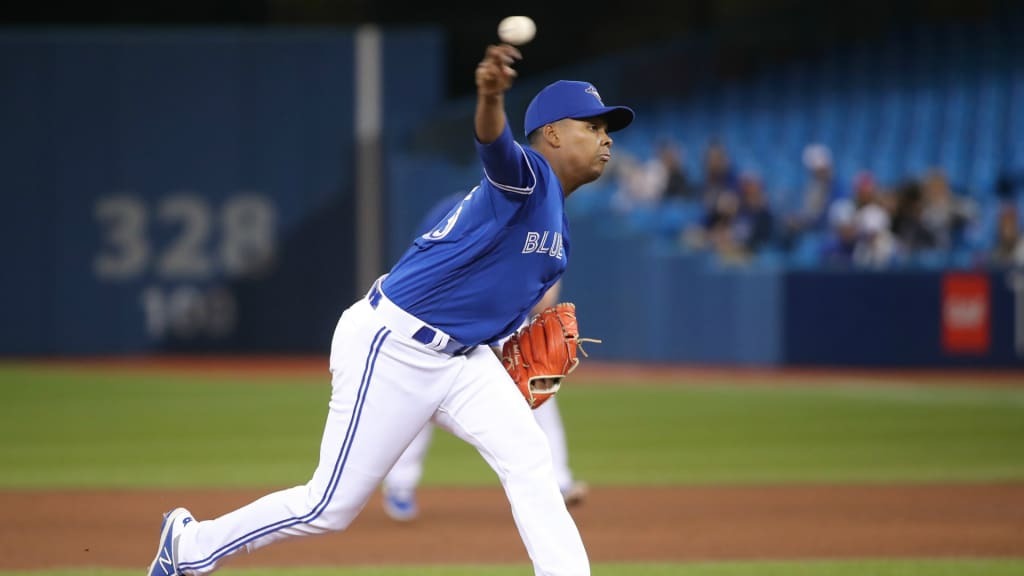
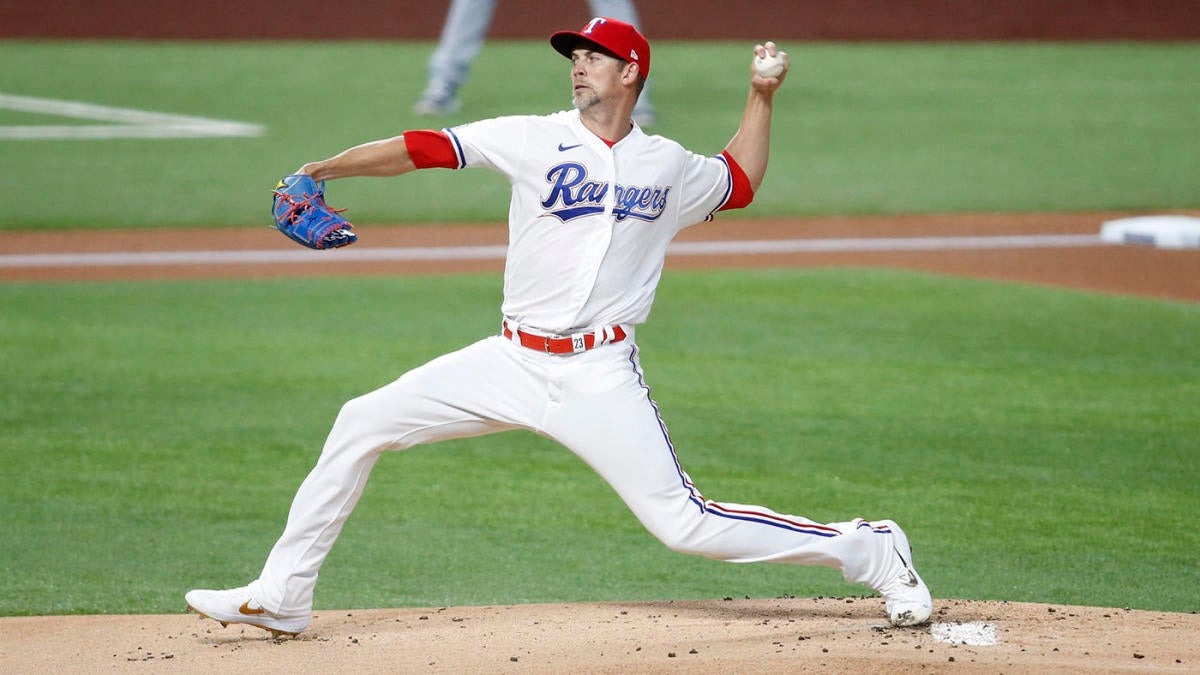
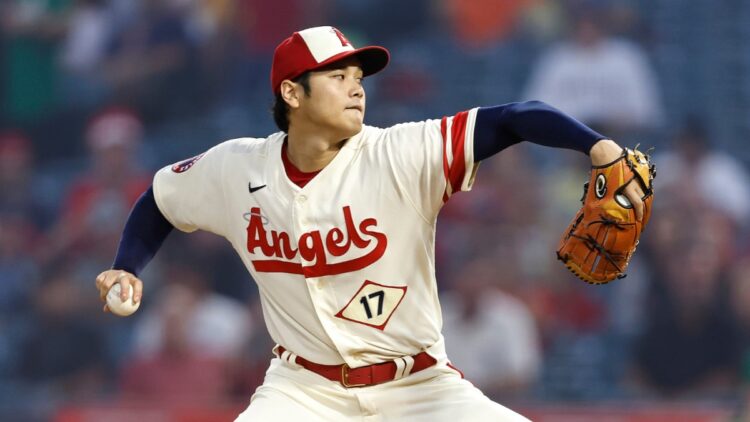
Baseball is a game of statistics. For pitchers, one of the most important stats is innings pitched, commonly abbreviated as IP or INN. Innings pitched simply refers to the number of innings a pitcher has worked in a game or over the course of a season.
What Constitutes an Inning Pitched?
For a pitcher to be credited with an inning pitched, they must record at least one out in the inning. As long as the pitcher records even just a single out before being removed from the game or ending the inning, they will be credited with having pitched that inning.
Some key things to note about innings pitched:
- A pitcher does not necessarily have to pitch a full inning to be credited. Recording just one out still counts as an inning pitched.
- If a starting pitcher is removed in the middle of an inning, and a relief pitcher comes in to record the remaining outs, both pitchers will be credited with an inning pitched.
- Innings pitched are counted as whole numbers. For example, if a pitcher throws 2/3 of an inning, it will show up in their stats as 0.2 innings pitched.
- Innings pitched only counts regular season innings. Postseason and exhibition innings are tracked separately.
- For statistical purposes, the innings pitched statistic treats each out as equal. A pitcher is credited the same whether they strike out the side or induce three weak groundouts.
Why Innings Pitched Is Important for Pitchers
For pitchers, innings pitched is important because it measures two key things: how deep into games they are pitching and how many total innings they are accounting for over a season.
Pitchers who can consistently pitch late into games take pressure off the bullpen and give their team a better chance to win. Logging a high total of innings pitched also means the pitcher is avoiding injury and taking on a bigger workload.
Since pitching puts great strain on a pitcher’s arm, the ability to shoulder a heavy workload is highly valued. Innings pitched is a quantifiable way to compare pitchers based on these durability and reliability factors. It helps managers evaluate a pitcher’s consistency and endurance.
Advanced stats have given rise to other ways of evaluating pitchers beyond innings pitched. However, it remains one of the core metrics that baseball analysts cite when discussing a pitcher’s overall body of work.

Pitch Counts and Their Relation to Innings Pitched
While innings pitched measures quantity, pitch counts provide important context on the quality of those innings.
A pitcher could pitch 6 innings but labor through high pitch counts each inning. Another pitcher could breeze through the same 6 innings on an efficient amount of pitches.
Here are some things to know about the interplay between innings pitched and pitch counts:
- Pitch counts provide insight into pitcher fatigue. A high pitch count early often leads to shorter outings.
- Pitching deep into games regularly can indicate efficiency and the ability to avoid high pitch counts.
- High pitch counts early in games put more strain on the bullpen to cover additional innings.
- Pitch counts combined with innings pitched help managers determine when a pitcher is tiring and needs to be removed.
- Innings pitched alone does not always portray how taxing an outing was on a pitcher’s arm. Pitch counts help fill in that context.
While innings pitched is important, pairing it with pitch count data provides a more detailed view of a pitcher’s workload and performance.
MLB Leaders in Innings Pitched
Throughout baseball history, some pitchers have dominated the innings pitched leaderboards during their careers. Here are some of the MLB leaders in innings pitched over various periods:
- All-Time: Cy Young (7,356 IP), Pud Galvin (6,003 IP), Walter Johnson (5,914 IP)
- Since 2000: CC Sabathia (3,093 IP), Bartolo Colon (3,031 IP), Mark Buehrle (2,882 IP)
- Single Season: Will White, 1879 (680 IP), Bill Hutchinson, 1890 (656.2 IP), Pud Galvin, 1883 (646 IP)
- Active: Zack Greinke (2,799 IP), Max Scherzer (2,639 IP), Justin Verlander (2,588 IP)
- Rookie Season: Bill James, 1914 (375.2 IP), Grover Cleveland Alexander, 1911 (367 IP), Christy Mathewson, 1900 (332 IP)
These innings pitched totals demonstrate the almost unthinkable durability and consistency of some elite pitchers throughout history. Their ability to log so many innings while maintaining effectiveness is incredibly impressive.
Interpreting a Pitcher’s Innings Pitched Totals
When evaluating a pitcher’s total innings pitched, here are some things to consider:
- ERA vs IP: If a pitcher has a high ERA but also a lot of innings, it could indicate they pitch deep into games but give up lots of runs. You’d want to look at their WHIP and hits allowed.
- IP vs Team IP: Compare a pitcher’s innings to their team’s total innings. If they account for a high percentage, it shows their value as an innings eater.
- IP Year to Year: Look for trends in innings pitched from season to season. Steady or increasing innings indicates durability. Sharp declines could be a sign of injury.
- IP vs Peers: Compare innings pitched to other pitchers from the same era. This provides context on their workload relative to peers. High IP compared to others demonstrates value.
- IP vs Pitch Count: As mentioned earlier, reviewing the pitch counts is important context for understanding the quality of innings pitched.
Innings pitched alone doesn’t tell you everything about a pitcher. But analyzing it in the context of other stats provides valuable insights into a pitcher’s ability, consistency, and value to their team over time.
Striking the Right Balance with Innings Pitched
While a high innings pitched total is generally a positive, pitching too many innings can also be detrimental to a pitcher’s arm. Throughout baseball’s history, philosophies on proper innings totals for pitchers have evolved significantly along with advances in sports medicine.
For most starting pitchers in today’s game, best practices suggest aiming for around 200 innings pitched over a season. This balances a pitcher’s value to their team with the need to avoid overuse injuries. Pitchers who consistently exceed 200 innings pitched in multiple seasons can be at heightened risk of injury.
However, some pitchers demonstrate the durability and mechanics to sustain heavier workloads of 230-250+ innings pitched over a full season. The key is closely monitoring indicators like velocity and command to ensure the pitcher isn’t wearing down.
For young pitchers especially, most teams now pace their innings and pitch counts carefully to promote healthy development. This approach has changed drastically from baseball’s earliest days when pitchers would routinely throw over 600 innings in a season.
While racking up innings pitched demonstrates value, modern baseball also emphasizes balancing that with effectiveness, efficiency, and long-term pitcher health.

Factors That Limit a Pitcher’s Innings Pitched
Aside from poor performance, there are a few key factors that can limit the number of innings a pitcher throws:
- Injuries: Arm and upper body injuries often directly force pitchers to miss games and innings. Preventing injuries through proper training, mechanics, and rest is essential.
- Pitch Limits: As mentioned earlier, most teams now limit pitchers to around 100 pitches per start to promote health, especially for young pitchers. This inevitably limits innings pitched.
- Blowouts: If a pitcher’s team is losing by a wide margin, the manager will often remove them earlier to conserve pitches and innings for the next outing.
- Shutting Down at Season’s End: Teams in the playoff hunt will often shut down or skip starts for key pitchers in September to keep them fresh for the playoffs, reducing innings pitched.
- Pitcher Role: Relievers and closers generally pitch fewer innings because they are used situationally rather than pitching complete games.
While high innings pitched indicate durability, sometimes factors outside a pitcher’s control prevent them from pitching deep into games consistently. Evaluating why their innings are limited provides important context.
Significance of 200+ Innings Pitched in a Season
One benchmark for an excellent season for a starting pitcher is 200+ innings pitched. Hitting this total means a pitcher is consistently pitching deep into games and avoiding the durability issues that often sideline starters.
Here is an overview of the significance of the 200 innings pitched milestone:
- Demonstrates pitcher’s health and fitness to maintain a starter’s workload throughout a full season.
- Reduces strain on the bullpen by minimizing reliever usage.
- Provides pitcher the opportunity to accumulate higher win, strikeout, and other key totals.
- Indicates pitcher’s effectiveness and/or team’s trust by allowing him to go deep into games routinely.
- Keeps pitcher in Cy Young and other award consideration by compiling a full body of work.
- Earning a rotation spot the next season is highly likely for a 200+ inning pitcher.
While there are always exceptions, reaching 200 innings pitched is still a key benchmark that signifies an excellent and durable season for an MLB starting pitcher.
Limitations of Innings Pitched as a Statistic
Despite being one of the most important measures of a pitcher’s performance, innings pitched does have some limitations as a standalone statistic:
- No Quality Component: Innings pitched only measures quantity of innings, not how effective or efficient those innings were.
- Team Dependent: Pitchers on bad teams that lose often don’t pitch as many innings.
- Run Environment: Pitching in certain ballparks or eras inflates/deflates innings totals.
- Role Dependent: Starters account for most innings so relievers are at a disadvantage.
- Health Assumption: More innings isn’t always better if a pitcher gets injured from overuse.
For these reasons, innings pitched must be considered alongside stats like ERA, WHIP, and pitch counts to properly evaluate a pitcher’s full body of work. In moderation, it remains one of baseball’s most telling stats.
The Record-Holding Seasons for Innings Pitched
While today’s starting pitchers topping 200 innings is considered a heavy workload, pitchers in the early 20th century and late 1800s would routinely throw over 600 innings in a season. These staggering totals demonstrate unthinkable durability. Here are some of the record-holding seasons:
- Will White, 1879 – 680 innings pitched
White set the all-time single season record that still stands today with 680 innings for the Cincinnati Reds in 1879. During that season, the right-hander started and completed an unfathomable 75 of the Reds’ 80 games, which was typical in that era. He amassed 43 wins while allowing just over 200 earned runs and striking out 179 batters.
- Pud Galvin, 1884 – 646 innings pitched
Galvin surpassed 600 innings three times in his career, but his peak came in 1884 when he totaled 646 innings for the Buffalo Bisons of the National League. He started 72 games that season and completed an incredible 71 of them while racking up 46 wins. Galvin was one of the most durable pitchers in an era where 600+ innings seasons were common among starters.
- Bill Hutchinson, 1890 – 655.2 innings pitched
As a 23-year-old rookie for the Chicago Colts in 1890, Hutchinson etched his name in the record books with 655.2 innings pitched. He accounted for an incredible 76% of the Colts’ total innings that season. The right-hander started and completed 69 of Chicago’s 98 games with 42 wins, 385 strikeouts, and a 2.74 ERA. It began a string of seven straight seasons with over 390 innings pitched.
- Old Hoss Radbourn, 1884 – 678.2 innings pitched
Radbourn owns two of the greatest innings-eaten seasons in MLB history. First in 1883 with 632 innings, then his epic 1884 season with 678.2 innings pitched for the Providence Grays. Despite being only 5’9″ and 168 pounds, Radbourn made 75 starts that year, completing an astounding 73 of them with 59 wins, a 1.38 ERA, and 441 strikeouts. A truly ridiculous workload that will almost certainly never be matched again.
Young Pitching Phenoms with High Innings Totals
While being eased into the majors is the norm for pitchers today, there have been some standout rookies who shouldered very heavy workloads and thrived, showing remarkable durability and composure. Here are some of the most notable high innings seasons by young pitching phenoms:
- Dwight Gooden, 1985 – 276.2 innings at age 20
At just 20 years old, Dwight “Doc” Gooden took the league by storm with one of the most dominant rookie seasons ever. With a blazing fastball and nasty curve, Gooden won NL Rookie of the Year and finished second in Cy Young voting with a 24-4 record, 1.53 ERA, and 268 strikeouts over 276.2 electric innings for the Mets.
- Fernando Valenzuela, 1981 – 192.1 innings at age 20
Valenzuela was an instant sensation for the Dodgers in 1981, winning both the Rookie of the Year and Cy Young awards. His signature screwball baffled opposing hitters as the Mexican left-hander went 13-7 with a 2.48 ERA and 180 strikeouts. He was a workhorse right away, completing 10 of his 25 starts and pitching two shutouts in his 192.1 innings.
- Vida Blue, 1971 – 312 innings at age 21
Leading the league in ERA, shutouts, and WHIP as a 21-year-old in just his first full season, Vida Blue also amassed 312 innings across 39 starts for the A’s in 1971. He demonstrated a blazing fastball and hammer curveball in winning both the AL MVP and Cy Young awards with a 24-8 record and 301 strikeouts.
- Christy Mathewson, 1901 – 332 innings at age 20
As a rookie for the New York Giants in 1901, Mathewson burst onto the scene by compiling a 20-17 record, 2.41 ERA, and 8.9 bWAR over an impressive 332 innings. He displayed pinpoint command with only 43 walks while setting the stage for his Hall of Fame career in the decade to follow with his precocious rookie campaign.

High Innings Totals in the Steroid Era
While performance enhancing drugs enabled many players to put up huge numbers in the 1980s and 90s, some pitchers also proved exceptional durable workhorses in the Steroid Era. Here are some notable innings totals with the context of that high-offense period:
- Roger Clemens, 1997 – 264 innings
In his final season with the Red Sox at age 34, Clemens led the AL in innings (264), ERA (2.05), and strikeouts (292). His power and longevity stood out, as did his ability to maintain elite performance despite the highly juiced offensive environment. He would pitch another decade until age 44.
- Randy Johnson, 1999 – 271.2 innings
The Big Unit topped 270 innings for the Diamondbacks in 1999, leading MLB with 364 strikeouts and 2,147 pitches thrown. At age 35, he showed no signs of slowing down, capturing the NL Cy Young award with 17 wins and a 2.49 ERA over his 271.2 innings of work.
- Curt Schilling, 1998 – 268.2 innings
Schilling emerged as an innings eating workhorse in his first year with the Phillies in 1998, compiling 268.2 innings at age 31. Despite the offense-first era, he led the NL with 319 strikeouts and was runner-up in the Cy Young voting with a 15-14 record, 3.25 ERA, and 5 shutouts.
- Greg Maddux, 1998 – 251 innings
Never one to overpower batters with velocity, Maddux was a model of efficiency. At age 32 in 1998, he pitched to a 2.22 ERA and 1.03 WHIP over 251 innings despite the highly inflated run-scoring environment. Using intelligence, movement, and location, Maddux outpitched the Steroid Era to put together a masterful 18-9 season.
Maintaining Workhorse Status in the Modern Game
While historical totals are almost unthinkable today, some star pitchers have maintained a strong workload through their 30s in recent seasons. They provide a blueprint for extended excellence amid modern practices focused on injury prevention. Notable examples:
- Justin Verlander – 228 IP in 2019 at age 36
In his late-career renaissance, Verlander has continued defying the odds. In 2019 at age 36, he led the majors with 223 IP while capturing his second Cy Young award with 21 wins and a 2.52 ERA. He followed up with 206 IP in an abbreviated 2020 season.
- Zack Greinke – 202 IP in 2019 at age 35
Greinke has long been an ultra-durable rotation anchor, having eclipsed 200 innings seven times. In 2019 at age 35 with the Diamondbacks, he maintained elite form by pitching 202 innings with a 2.90 ERA, 0.98 WHIP, and 187 strikeouts.
- Max Scherzer – 172.1 IP in 2020 at age 35
Scherzer has been a workhorse throughout his 30s, twice topping 300 strikeouts in a season. After getting traded to the Nationals in 2020, he led the majors with a 1.79 ERA and 0.78 WHIP over 172.1 innings in the shortened season at age 35.
- Adam Wainwright – 206.1 IP in 2019 at age 37
Despite missing major time with injuries, Wainwright has rebounded and continues chewing up innings late in his career. In 2019 at age 37, he pitched 206.1 innings for St. Louis across 31 starts, going 14-10 with a 4.19 ERA in a vintage workhorse campaign.
Conclusion
While baseball continues to evolve statistically, innings pitched remains one of the fundamental measures that demonstrates a pitcher’s durability, consistency, and value to their team. The ability to shoulder a heavy workload while avoiding injuries and excavations is still highly valued.
However, modern usage patterns also reflect increased understanding of injury prevention and pitching effectiveness. Despite some limitations as a standalone statistic, innings pitched still provides powerful insight into a pitcher’s body of work over the course of a season or career. When paired with additional stats for context, it reveals a pitcher’s reliability, health, and role on their team in a quantifiable way.
Frequently Asked Questions
What is considered a good number of innings pitched for a starting pitcher?
For most starting pitchers, throwing between 180-220 innings over a full season is considered a healthy and productive total. Pitchers who exceed 220 innings are taking on an increased workload that can heighten injury risk.
How many innings do most relievers pitch?
On average, relief pitchers typically throw between 60-80 innings over the course of a full season. Closers and high-usage setup men might reach up to 100 innings out of the bullpen.
Who determines how many innings a pitcher throws?
Usage is primarily determined by the team’s manager and pitching coach based on health, game situations, and effectiveness. Organizations also set general limits on pitcher usage and pitch counts, especially for developing pitchers.
Do playoff innings count towards a pitcher’s season innings total?
No, regular season and postseason statistics are tracked separately. Only regular season innings are counted towards a pitcher’s innings pitched totals. Postseason numbers reflect their usage solely in playoff games.
How has innings pitched evolved over time in baseball?
Early in baseball’s history, pitchers would routinely throw over 600 innings in a season. As medical understanding has improved, today’s starting pitchers generally top out around 250 innings as teams try to balance workload and injury prevention.


